oos-controllerVersion 1.2
Dashboard
Dashboard
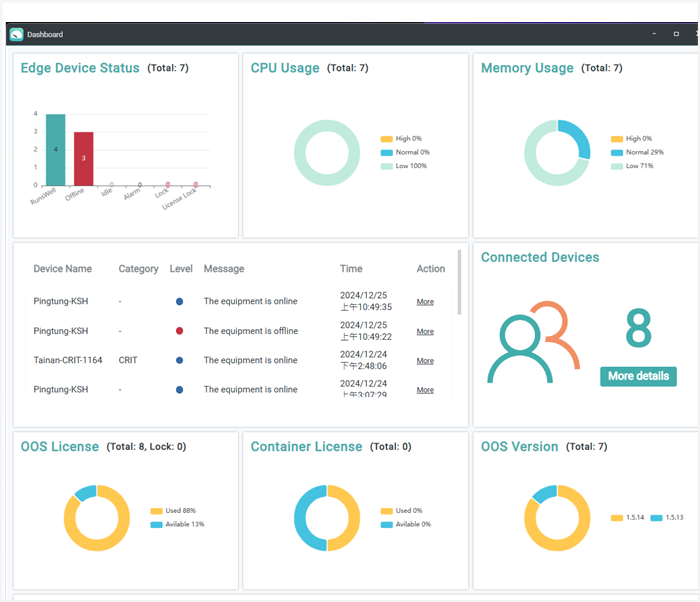
The Dashboard provides a comprehensive overview of the operational status and performance metrics of your managed OOS devices. It helps administrators monitor key parameters, identify potential issues, and optimize system performance efficiently.
The Dashboard displays the following key information:
- Status: Overall health of managed devices.
- CPU and Memory Usage: Utilization of CPU and memory for each device.
- Messages: System notifications and alert messages.
- Connected Client Devices: Details on currently connected client devices.
- License: Current OOS and Container license details and validity status.
- OOS Version: The software version running on each device.
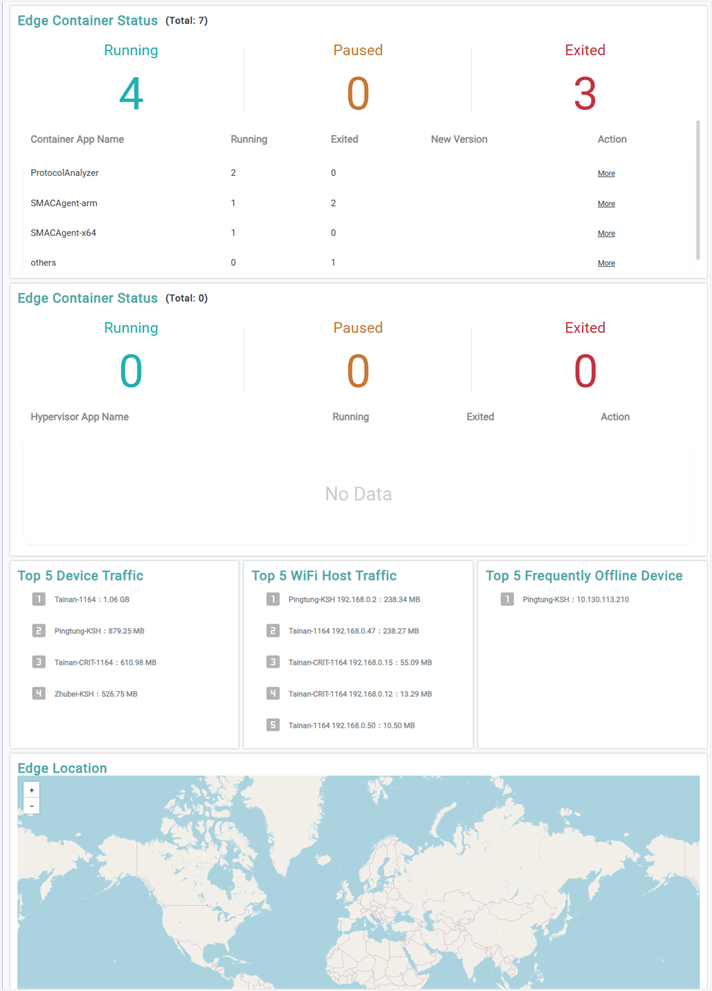
- Container and Hypervisor Status: The operational state of containers and hypervisors.
- Top 5 Rankings: Performance rankings across key metrics.
- OOS Edge Locations: Geographic locations of deployed OOS edge devices.